
Tracking
 Eleanor Weiss
·
6 min read
Eleanor Weiss
·
6 min read
Cookieless Tracking: How to Measure Visitors Without Cookies
Cookieless tracking sounds almost too good to be true: you measure your website traffic, but you skip the…

Contents
Most small business owners open their analytics dashboard, see dozens of charts and numbers, and immediately close the tab. I know this feeling well — after years of helping businesses make sense of their data, I’ve learned that website analytics for small business doesn’t have to be overwhelming. In fact, tracking fewer metrics often leads to better decisions.
The problem isn’t analytics itself. It’s the assumption that you need to monitor everything. You don’t. Instead, you need to focus on the metrics that actually matter for your specific goals. In this guide, I’ll show you exactly what to track — and more importantly, what you can safely ignore.
Google Analytics 4 offers over 200 different metrics. That’s not a feature — it’s a trap. When you try to monitor everything, you end up understanding nothing. Moreover, the time spent analyzing vanity metrics is time not spent actually improving your business.
Here’s what typically happens: a small business owner sets up analytics, gets excited about the data, and then gets lost in reports that don’t connect to real business outcomes. Consequently, they either abandon analytics entirely or make decisions based on metrics that don’t actually matter.
The solution is simple. Pick a handful of metrics that directly relate to your business goals. Everything else is noise.
After testing dozens of analytics setups for small businesses, I’ve found that most owners only need to track five core metrics. These numbers tell you everything you need to know about your website’s health and effectiveness.
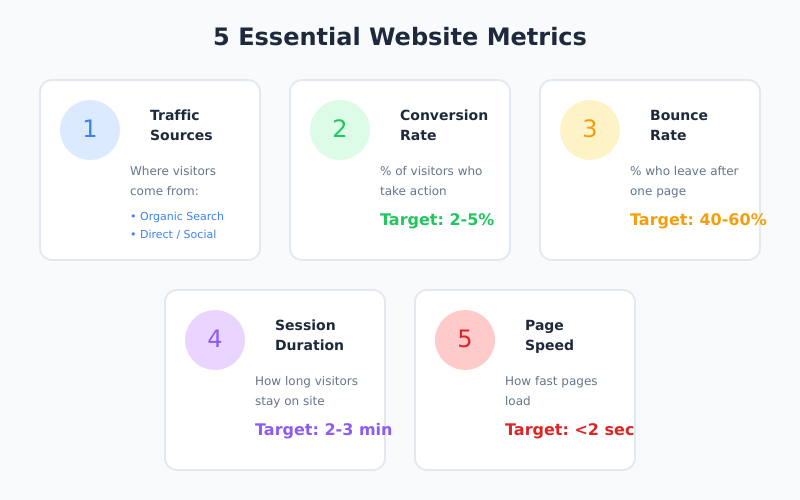
Where are your visitors coming from? This is the first question any business owner should ask. Traffic sources reveal which marketing channels actually work for your business.
Typically, your traffic breaks down into these categories:
For example, if 70% of your traffic comes from organic search, you know that SEO is working. On the other hand, if social media drives almost nothing despite hours of posting, it might be time to reconsider that strategy.
Traffic means nothing if visitors don’t take action. Therefore, conversion rate is arguably the most important metric for any business website. It measures the percentage of visitors who complete a desired action — whether that’s making a purchase, signing up for a newsletter, or requesting a quote.
A “good” conversion rate varies by industry. However, most websites see rates between 2-5%. If you’re below 1%, there’s likely a problem with your offer, messaging, or user experience.
Pro tip: If you’re new to analytics, start by tracking just this one metric. Conversion rate directly ties to revenue, making it the clearest indicator of website effectiveness.
Bounce rate measures the percentage of visitors who leave after viewing only one page. A high bounce rate often signals that visitors aren’t finding what they expected.
That said, context matters. A blog post with a 70% bounce rate might be perfectly fine — readers got the information they needed and left. Conversely, a product page with the same bounce rate is a serious problem.
Generally, aim for these benchmarks:
| Page Type | Good Bounce Rate | Concerning |
|---|---|---|
| Landing pages | 30-50% | Above 70% |
| Blog posts | 40-60% | Above 80% |
| Product pages | 20-40% | Above 60% |
| Homepage | 40-60% | Above 75% |
How long do visitors stay on your site? This metric indicates whether your content is engaging enough to hold attention. High-converting websites typically see average session durations of around 2-3 minutes.
However, don’t obsess over this number in isolation. A visitor who spends 30 seconds, finds exactly what they need, and converts is more valuable than someone who browses for 10 minutes and leaves without action. As a result, always consider session duration alongside conversion rate.
Speed matters more than most business owners realize. According to research, 83% of users expect websites to load in three seconds or less. Every additional second increases bounce rate and decreases conversions.
Furthermore, page speed affects your search rankings. Google considers load time a ranking factor, so slow sites struggle to appear in search results. Ideally, aim for a load time under 2 seconds.
Now for the liberating part. Here are metrics that small businesses often track but rarely need:
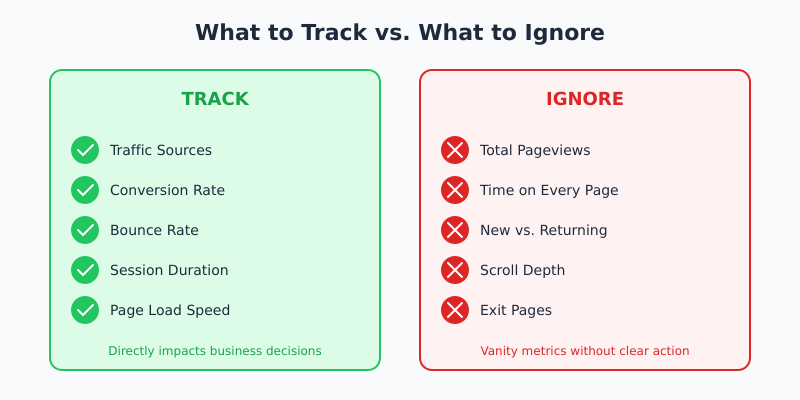
Pageviews sound impressive in reports but tell you almost nothing useful. A single visitor viewing 20 pages might indicate engagement — or confusion. Without context, this number is meaningless.
Tracking time on page for your entire site creates noise. Instead, only monitor this for key pages like sales pages or important content pieces. For most pages, this data adds no value.
This metric sounds strategic but rarely drives decisions. Unless you’re running specific campaigns targeting one group, the ratio between new and returning visitors doesn’t matter much for day-to-day operations.
Some analytics tools track how far visitors scroll down pages. While occasionally useful for long-form content, this metric is overkill for most small business websites. If your conversion rate is healthy, scroll depth is irrelevant.
Every visitor eventually leaves. Knowing which page they left from rarely provides actionable insights. Focus on improving entry pages and conversion paths instead.
The metrics you prioritize should depend on what you’re trying to achieve. Here’s a simple framework:
| Your Goal | Primary Metrics | Secondary Metrics |
|---|---|---|
| Increase sales | Conversion rate, Revenue per visitor | Cart abandonment, Product page views |
| Generate leads | Form completion rate, Cost per lead | Landing page bounce rate |
| Build audience | Email signups, Traffic growth | Content engagement, Social shares |
| Improve SEO | Organic traffic, Keyword rankings | Click-through rate from search |
Notice how each goal has just 2-3 primary metrics. That’s intentional. The more focused your tracking, the clearer your insights.
You don’t need complex tools to track these essential metrics. In fact, simpler tools often provide clearer insights because they’re not cluttered with features you’ll never use.
Tools like Plausible and Fathom offer streamlined dashboards that focus on essential metrics only. They’re also GDPR-compliant and don’t require cookie consent banners.
These tools deliberately limit what they track. As a result, you see a clean dashboard with exactly the metrics discussed in this article — nothing more, nothing less.
If you use Google Analytics 4, you can create a custom dashboard showing only essential metrics. However, this requires setup time and discipline to avoid getting lost in other reports.
The advantage of GA4 is that it’s free and powerful. The disadvantage is that power — it’s easy to spend hours exploring data that doesn’t help your business.
For businesses that want full control over their data, self-hosted options like Matomo or Rybbit provide privacy-friendly tracking on your own servers. This approach requires more technical knowledge but offers complete data ownership.
Tracking metrics is pointless without regular review. However, daily monitoring leads to overreaction to normal fluctuations. Instead, establish a weekly review routine.
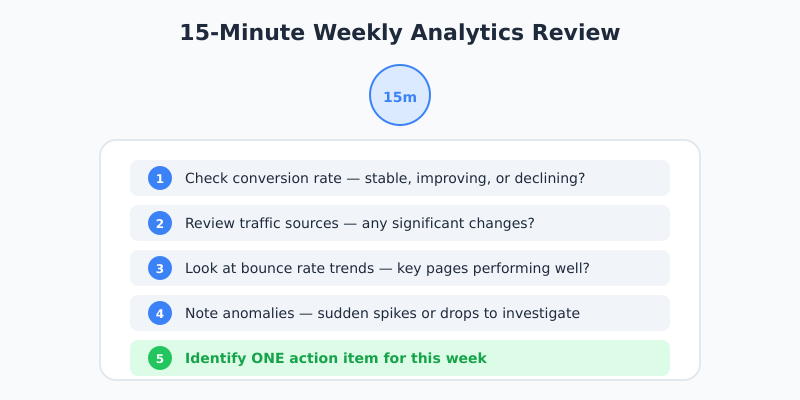
Here’s a simple 15-minute weekly review process:
That’s it. Fifteen minutes, once a week, focused on metrics that matter. This approach provides enough insight without consuming your time.
Sometimes you need more detailed analysis. Here are situations that warrant deeper investigation:
In these cases, it makes sense to dig into additional metrics. Otherwise, stick to the essentials.
Based on my experience helping small businesses with analytics, here are the most common pitfalls:
Industry benchmarks are averages that may not apply to your specific situation. A 3% conversion rate might be excellent for your niche but poor for another. Therefore, focus on improving your own numbers rather than matching arbitrary standards.
One week of data isn’t enough to identify trends. Before making significant changes based on analytics, ensure you have at least a month of data — preferably more. Otherwise, you’re reacting to random variations.
Over 64% of web traffic now comes from mobile devices. If your analytics show poor mobile performance, that’s not a minor issue — it affects the majority of your visitors.
The purpose of analytics is to inform decisions. If you’re tracking metrics but never making changes based on the data, you’re wasting time. Every metric you track should connect to a potential action.
Website analytics for small business should be simple. Track traffic sources to understand what’s working. Monitor conversion rate to measure effectiveness. Watch bounce rate and session duration for engagement signals. Keep an eye on page speed for technical health.
That’s five metrics. Everything else is optional until you have specific reasons to track it.
The goal isn’t to become a data analyst. It’s to make better decisions for your business. By focusing on fewer metrics, you’ll actually understand what the numbers mean — and more importantly, what to do about them.
Start with conversion rate this week. Just that one number. Once you understand how to improve it, add the next metric. Build your analytics practice gradually, and you’ll never feel overwhelmed by data again.
Eleanor Weiss is a certified digital marketer (Google Analytics IQ, HubSpot Inbound) with 10+ years of experience in website analytics. After spending weeks trying to figure out GA4, she asked herself: why? Most websites don't need complex funnels and machine learning. They need simple answers. That's why she started PrivacyAnalytics.io — honest reviews of privacy-friendly analytics tools that just work.
More about me →
Cookieless tracking sounds almost too good to be true: you measure your website traffic, but you skip the…

Most conversion funnel guides make a simple concept unnecessarily complex. They throw around terms like "TOFU," "MOFU," and…

Most online stores know the basics: traffic, total orders, revenue. When numbers go up or down, you see…