
Tracking
 Eleanor Weiss
·
6 min read
Eleanor Weiss
·
6 min read
Cookieless Tracking: How to Measure Visitors Without Cookies
Cookieless tracking sounds almost too good to be true: you measure your website traffic, but you skip the…

Contents
Most conversion funnel guides make a simple concept unnecessarily complex. They throw around terms like “TOFU,” “MOFU,” and “BOFU,” present seven-stage frameworks, and suggest tracking 15+ metrics. For enterprise companies with dedicated analytics teams, that might work. For small businesses? It’s overkill.
Here’s what I’ve learned after years of working with website analytics: conversion funnel analysis doesn’t need to be complicated. In fact, the simpler your approach, the more likely you are to actually use the insights and improve your results.
This guide strips funnel analysis down to what actually matters. No jargon overload. No enterprise-level complexity. Just practical metrics and actionable steps that work for businesses of any size.
A conversion funnel is simply the path visitors take from first discovering your website to completing a desired action — whether that’s making a purchase, signing up for a newsletter, or booking a consultation.
The “funnel” metaphor exists because fewer people complete each subsequent step. If 1,000 people visit your site, maybe 100 view a product page, 20 add something to cart, and 5 actually purchase. That narrowing pattern looks like a funnel.
Understanding where people drop off — and why — is the entire point of funnel analysis. However, you don’t need sophisticated tools or complex frameworks to get useful insights.
Traditional marketing theory describes funnels with stages like Awareness, Interest, Consideration, Intent, Evaluation, and Purchase. Some models add Loyalty and Advocacy on top. That’s useful for academic discussions, but for practical optimization? Three stages are enough.
How do people find you? This includes all traffic sources — organic search, social media, referrals, direct visits, and paid ads. At this stage, you’re measuring whether your marketing efforts actually bring people to your site.
Key question: Are the right people finding my website?
Once visitors arrive, do they stick around? Do they view multiple pages, read your content, or interact with your site? This stage separates casual browsers from genuinely interested prospects.
Key question: Are visitors interested in what I offer?
Finally, do engaged visitors take the action you want? This could be a purchase, signup, contact form submission, or any other goal that matters to your business.
Key question: Are interested visitors becoming customers or leads?
That’s it. Three stages, three questions. Every optimization effort you make should target one of these stages. If you can answer these questions with data, you understand your funnel well enough to improve it.
According to industry research, nearly 68% of businesses don’t measure their customer journey funnel at all. Meanwhile, those who track too many metrics often suffer from analysis paralysis. The solution isn’t more data — it’s focusing on the metrics that drive decisions.
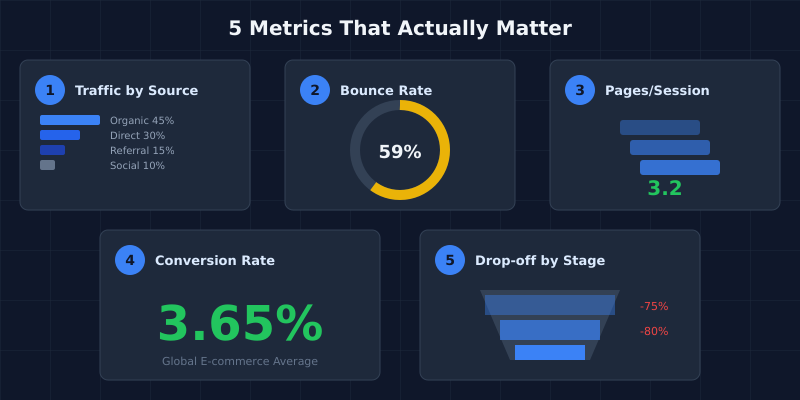
Here are the five metrics worth tracking:
Not just total visitors, but where they come from. This tells you which marketing channels actually work. A channel bringing 500 visitors who never convert is less valuable than one bringing 50 visitors who regularly buy.
| Source Type | What It Tells You | Healthy Sign |
|---|---|---|
| Organic Search | SEO effectiveness | Steady growth over time |
| Direct | Brand recognition | Returning visitors |
| Referral | Partnership/content value | High engagement rate |
| Social | Social media ROI | Matches target audience |
| Paid | Ad spend efficiency | Cost per acquisition in target range |
Bounce rate measures visitors who leave without any interaction. The average e-commerce bounce rate hovers around 59%. However, the number itself matters less than the pattern.
A blog post with 70% bounce rate might be fine — people read and leave. A product page with 70% bounce rate is a problem. Context matters.
Look for outliers. If most pages bounce at 50% but one page bounces at 85%, that page needs attention.
This metric reveals engagement depth. Are visitors exploring your site or leaving after one page? For e-commerce, higher pages per session often correlates with higher purchase intent. For service businesses, it suggests visitors are researching your offerings.
Typical benchmarks:
The percentage of visitors who complete your primary goal. This is the metric most businesses obsess over — sometimes too much. The global e-commerce conversion rate averages around 3.65%. If you’re above that, you’re doing well. If you’re below, there’s room to improve.
Calculate it simply:
Conversion Rate = (Conversions ÷ Total Visitors) × 100
For example: 50 sales from 2,000 visitors = 2.5% conversion rate.
This is where funnel analysis gets actionable. Instead of just knowing your overall conversion rate, you identify where people leave. If 80% of visitors view products but only 10% add to cart, your product pages need work. If 40% add to cart but only 5% complete checkout, your checkout process is the bottleneck.
| Funnel Stage | Example Metric | Warning Sign |
|---|---|---|
| Discovery → Engagement | Bounce rate > 70% | Wrong traffic or poor landing page |
| Engagement → Intent | < 5% view key pages | Navigation issues or weak value proposition |
| Intent → Conversion | Cart abandonment > 80% | Checkout friction or trust issues |
Identifying where visitors leave is straightforward with most analytics tools. Here’s a practical approach:
What pages should a visitor see before converting? For an e-commerce site, it might be: Homepage → Category → Product → Cart → Checkout. For a service business: Homepage → Services → About → Contact.
How many visitors reach each page in the sequence? If 1,000 visit your homepage, how many reach your services page? How many then visit your contact page?
The math is simple:
Drop-off Rate = ((Stage 1 Visitors - Stage 2 Visitors) ÷ Stage 1 Visitors) × 100
If 500 people view products and 100 add to cart, your product-to-cart drop-off is 80%. That’s your optimization target.
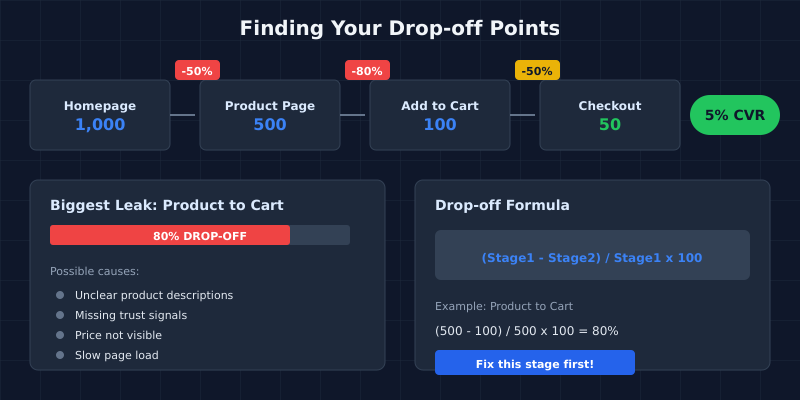
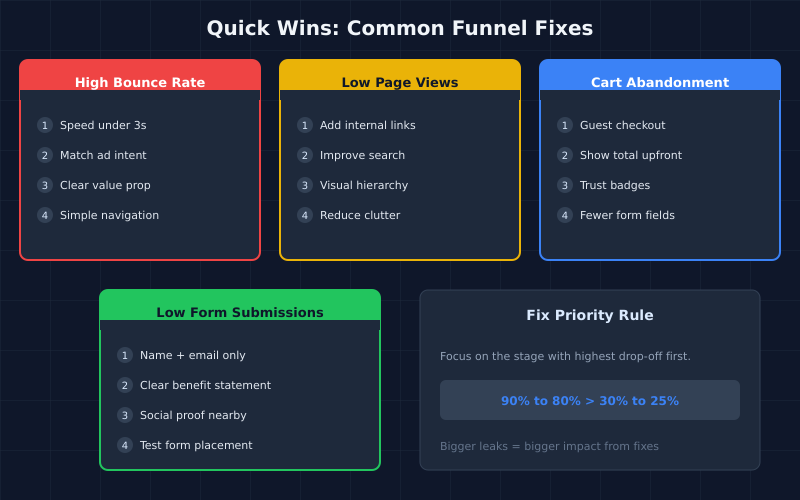
Focus on the stage with the highest drop-off rate first. Improving a 90% drop-off to 80% has more impact than improving a 30% drop-off to 25%. Simple math, but often overlooked.
Here’s something most analytics articles won’t tell you: not every business needs detailed funnel analysis. Similar to overcomplicating analytics in general, obsessing over funnels can waste time you could spend on actual improvements.
Funnel analysis might be overkill if:
In these cases, stick to basic metrics: traffic, conversions, and maybe traffic sources. Save funnel analysis for when your business complexity justifies it.
If you’ve identified drop-off points, here are proven fixes for each stage:
You don’t need invasive tracking to understand your funnel. Privacy-first analytics tools like privacy-first analytics tools can track page views, goals, and basic funnel steps without cookies or personal data collection.
For funnel analysis specifically, you need:
You don’t need:
The aggregate data from privacy-friendly tools is enough to identify patterns and optimize your funnel. As I explained in my guide on essential metrics for small business, sometimes less tracking actually gives you more clarity.
Conversion funnel analysis doesn’t require enterprise tools or a data science degree. At its core, it’s about answering three questions: Are the right people finding you? Are they engaging with your content? Are they taking action?
Track five metrics, identify where visitors drop off, and fix the biggest leaks first. That’s the entire process. Everything else is optimization for optimization’s sake.
If you’re spending more time analyzing your funnel than improving your product or content, you’ve gone too far. The goal isn’t perfect data — it’s a better business.
Eleanor Weiss is a certified digital marketer (Google Analytics IQ, HubSpot Inbound) with 10+ years of experience in website analytics. After spending weeks trying to figure out GA4, she asked herself: why? Most websites don't need complex funnels and machine learning. They need simple answers. That's why she started PrivacyAnalytics.io — honest reviews of privacy-friendly analytics tools that just work.
More about me →
Cookieless tracking sounds almost too good to be true: you measure your website traffic, but you skip the…

Most small business owners open their analytics dashboard, see dozens of charts and numbers, and immediately close the…

Most online stores know the basics: traffic, total orders, revenue. When numbers go up or down, you see…