Contents
- 1 Why Pageviews Aren’t Enough for Modern Online Stores
- 2 What Web Event Tracking Means for E-commerce
- 3 The Building Blocks of Analytics Events Tracking
- 4 Types of Website Events That Predict Revenue
- 5 How to See If an Event Really Drives Revenue
- 6 Turning Event Insights into Real Revenue Improvements
- 7 Common Event Tracking Mistakes in E-commerce (and How to Avoid Them)
- 8 Summary: A Small Set of Events, A Big Difference in Revenue
Most online stores know the basics: traffic, total orders, revenue. When numbers go up or down, you see it in a dashboard – but you still don’t know what people actually did on the site before they bought or dropped off.
That’s where events come in. Instead of thinking “this user saw three pages”, you think “this user viewed a product, checked shipping, added to cart, tried a coupon, got a payment error”. The pattern of actions tells you much more about future money than pageviews alone.
In this article, we’ll walk through a practical, tool-agnostic way to use event analytics in e-commerce to spot the specific on-site actions that really drive revenue. No platform-specific tutorials, just concepts, examples, and simple checks you can run in almost any stack.
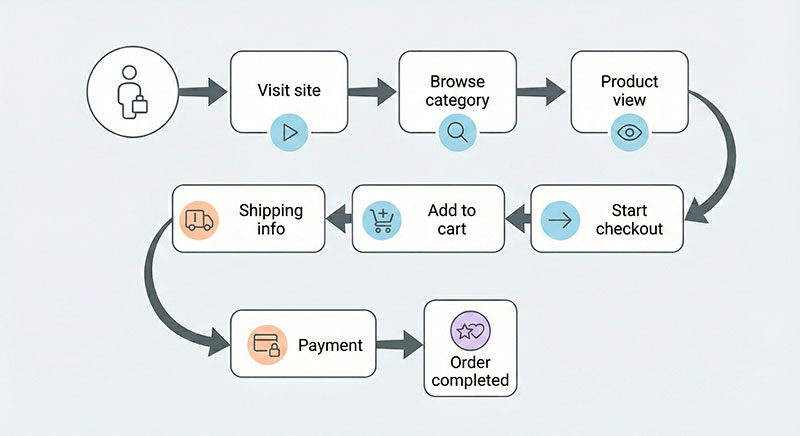
Imagine two visitors:
- Visitor A browses a category, skims two products, then leaves.
- Visitor B opens one product, scrolls to reviews, checks shipping, adds to wishlist, and only then closes the tab.
In a classic “sessions and pageviews” report, they might look similar. But Visitor B is clearly much closer to buying. Your goal is to track and measure those kinds of signals – and then design your store around them.
Why Pageviews Aren’t Enough for Modern Online Stores
The traditional analytics view is built around sessions and pageviews. You open a report and see:
- visits by channel
- top landing pages
- bounce rate
- one overall purchase conversion rate
Useful? Yes. But very shallow.
Pageviews can tell you:
- which pages people land on
- which pages they exit from
- rough engagement (time on site, pages per session)
They do not tell you:
- whether users looked at shipping or payment options
- which products they seriously considered
- where exactly the checkout experience broke
- what behaviors are common among people who end up spending a lot
Two ad campaigns can both send 10,000 visits and a similar number of orders. One might bring window shoppers; the other might bring people who use wishlist, apply coupons, and come back later. Page-level metrics hide this difference.
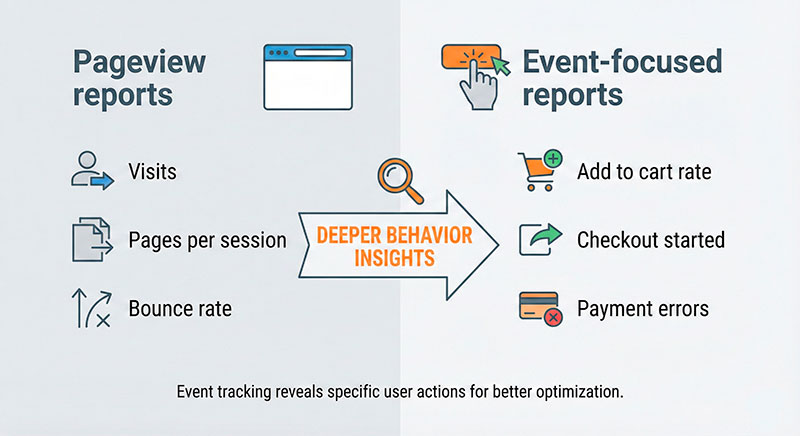
A simple way to think about it:
- Pageviews answer: “Where were they?”
- Events answer: “What did they try to do – and how did it go?”
If you want to push revenue instead of just traffic, you need that second layer.
If you want extra context for your numbers, you can always look up some generic ecommerce conversion rate benchmarks, but they will never explain why people convert. Events will.
What Web Event Tracking Means for E-commerce
Let’s put a simple definition on the table:
An event is a single, meaningful action a user takes on your site.
Some typical e-commerce events:
- product viewed
- image gallery interacted with
- added item to cart
- added item to wishlist
- viewed shipping options
- applied coupon
- started checkout
- completed order
Now compare two ways of seeing the same moment:
- Pageview version: “User saw
/checkoutpage.” - Event version: “User clicked ‘Pay now’, got a card declined error, tried again with another card.”
With web event tracking you treat each of those actions as a separate, explicit data point. That means you can later answer questions like:
- “How many users see shipping costs and then abandon?”
- “Do people who add to wishlist convert more over 30 days?”
- “Which coupons fail most often and kill the mood at checkout?”
Events turn your analytics from a simple map of pages into a play-by-play of user behavior.
If you want more theory, you can always read a generic guide on event-based web analytics, but the big idea is simple: track actions, not just visits.
The Building Blocks of Analytics Events Tracking
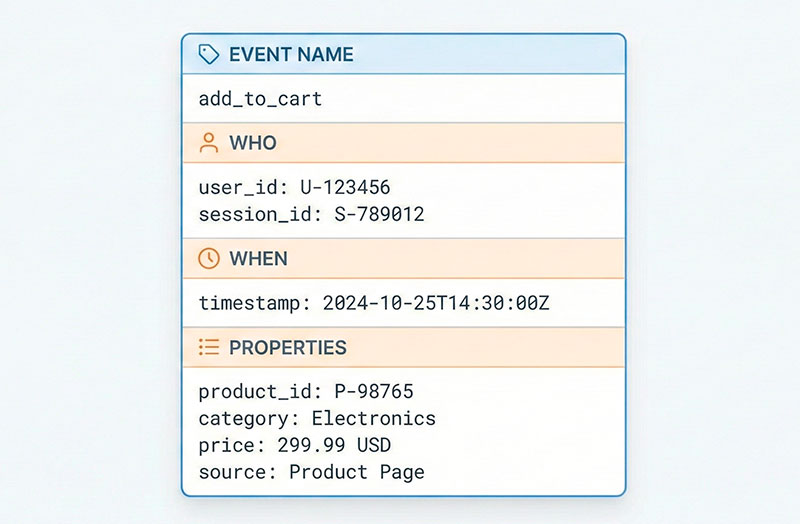
Under the hood, events are small structured messages. Most useful events in an online store share four ingredients:
- Name
A short, consistent label such asproduct_viewed,add_to_cart,checkout_started,order_completed. - Who did it
- A user ID for logged-in customers, or
- An anonymous/session ID for guests.
- When it happened
- A timestamp so you can rebuild the timeline.
- Properties (parameters)
Extra context that makes the event useful. For anadd_to_cartevent, that might be:product_idproduct_categorypricecurrencyquantitydiscount_code(if filled)source_medium
When you design your analytics events tracking, treat each event like a short sentence about what just happened:
“User 987 added product 123 from category ‘Sneakers’, size 42, price $89, using the SUMMER10 coupon, coming from an email campaign.”
That kind of detail lets you later slice behavior by category, price range, device, or traffic source.
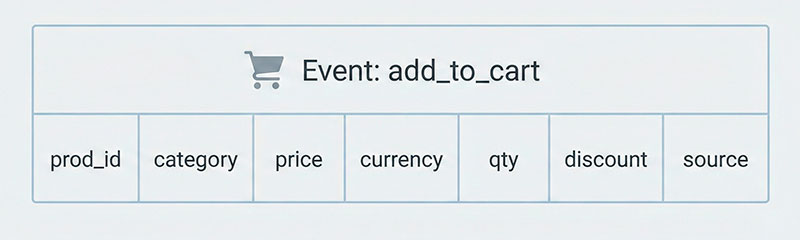
Here’s a simple way to imagine the properties for add_to_cart:
- Event:
add_to_cart - Properties:
product_id,product_category,price,currency,quantity,discount_code,source_medium
The trap, of course, is overkill. If every event has 30 random properties, half of them inconsistently filled, analysis becomes painful. Aim for:
- A small set of core event names that everyone understands.
- A few well-chosen properties per event that you actually use.
- A documented naming convention so future you doesn’t hate present you.
If you want inspiration on structures and naming, look for event taxonomy design examples from analytics vendors and product analytics blogs.
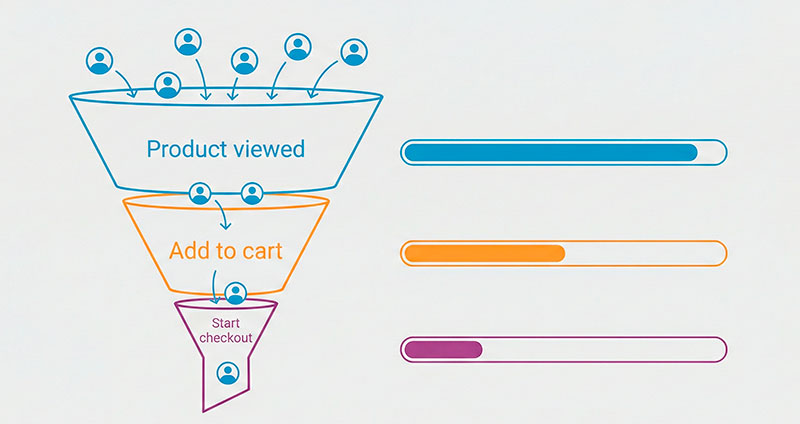
Types of Website Events That Predict Revenue
You can track a lot of different actions: scrolls, clicks, hovers, wishlist opens, filter changes… But only some of them are truly close to money.
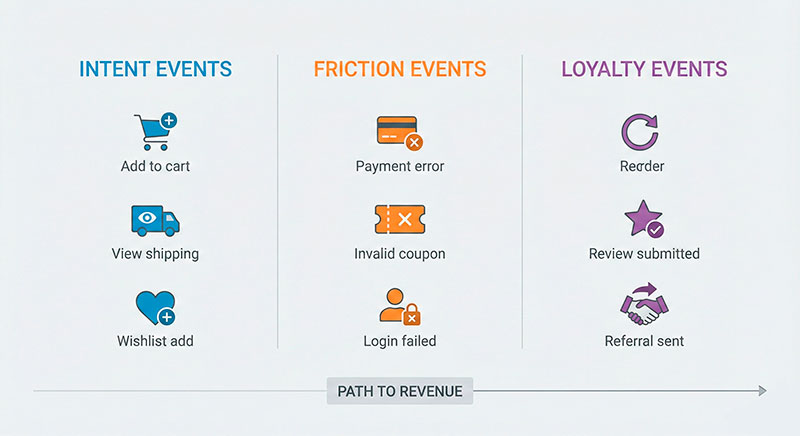
Effective website event tracking for e-commerce usually focuses on three families of events:
- Intent events – actions that say “I want this”.
- Friction events – actions that say “something is wrong”.
- Expansion and loyalty events – actions that say “I’ll probably buy again”.
We’ll go through each group with concrete examples.
“Intent” Events – Signals That a User Wants to Buy
“Intent” events are actions that show real buying interest. They sit closer to money than a simple product page view.
Common examples:
- Deep product views
Not just landing on the product page, but actually interacting:- scrolling,
- opening more photos,
- checking size guide,
- reading reviews.
Users who do that are much more likely to become customers.
- Add to cart
The classic “I might buy this” signal. Even if the order doesn’t happen right away, these users are perfect for retargeting, cart emails, or promotions. - Add to wishlist / favorites
Softer intent, but powerful in categories like fashion, beauty, hobbies, and electronics. Wishlists are a to-do list for future spending. - View shipping options
Opening a “Shipping & Delivery” section or popup. This is often where people decide if they feel comfortable with the final cost and timing. - Start checkout
Moving from basket to the first checkout step. Users here are in “last mile” territory.
A real-world style example:
A mid-sized store ran a simple check and found that users who viewed shipping options at least once had roughly double the purchase rate of those who never opened that section. After they moved shipping info higher on the page and made it clearer, more visitors reached that “I understand the total cost” state – and conversion followed.
“Friction” Events – Where Money Leaks from Your Funnel
“Friction” events point to pain. They don’t make money directly, but they explain where it disappears.
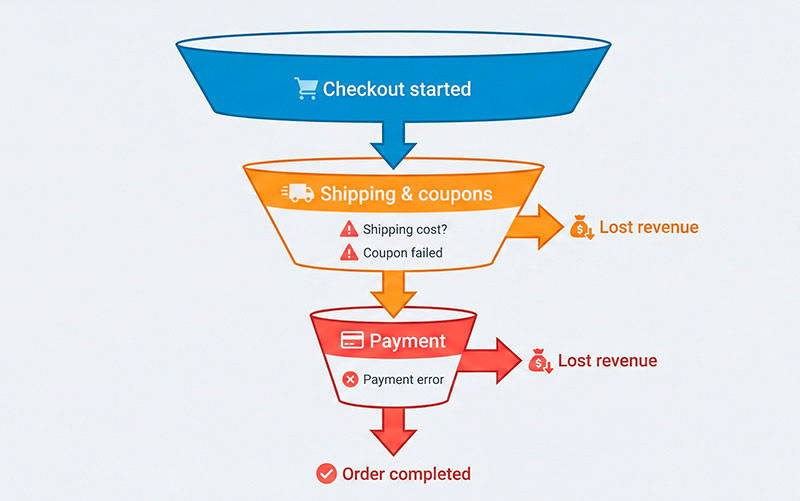
Typical friction events:
- Payment errors
- Card declined
- Technical gateway errors
- 3-D Secure failures
- Failed coupons / invalid promo codes
Users enter a code, click Apply… and see an error. That’s a bad emotional moment and a frequent reason to abandon. - Shipping sticker shock
The user opens shipping details, sees a price they didn’t expect, and quietly leaves. - Form validation errors on checkout
Things like:- “Phone number in wrong format”
- “Address not found”
- Confusing or hidden required fields
- Out-of-stock interactions
Users try to add an item that is unavailable.
Tracking these events helps you prioritize fixes. For example:
A team noticed a big cluster of sessions with multiple “coupon_invalid” events. Investigation showed that many users received outdated codes from old blog posts and affiliates. Cleaning up those codes and improving the error message reduced rage-quits and gave a small but measurable lift in checkout completion.
If you want inspiration on what good checkout changes can look like, check any solid checkout optimization case study and compare their “before vs after” with your friction events.
“Expansion and Loyalty” Events – Predictors of Future Revenue
Some events are not about today’s order, but about tomorrow’s orders.
Examples:
- Reorder button clicks
Common in groceries, pet supplies, supplements, cosmetics. If someone keeps reordering, that customer is very valuable. - Subscription upgrade or renewal
For subscription boxes or memberships, upgrades and on-time renewals show strong product–market fit. - Reviews submitted
Users who take time to write reviews:- care about the product,
- often trust the brand,
- tend to buy again.
- Referral link shared or used
This tells you “I like this enough to recommend it”. Strong trust signal. - Back-in-stock alerts subscribed
Users who ask to be notified when a product returns are waiting with money in hand.
One store discovered that customers who had clicked “Reorder” at least once had significantly higher lifetime revenue than one-time buyers. So they:
- Added a “Reorder your usual items” section to the homepage.
- Included quick reorder links in post-purchase emails.
The data about “Reorder” events didn’t just look nice in a dashboard – it directly shaped product and marketing decisions.
If you want to go deeper on this topic, look for a good ecommerce customer lifetime value guide and connect their LTV ideas with your loyalty events.
How to See If an Event Really Drives Revenue
Not every event you track will be a goldmine. The good news: you don’t need advanced statistics to find the strong ones.
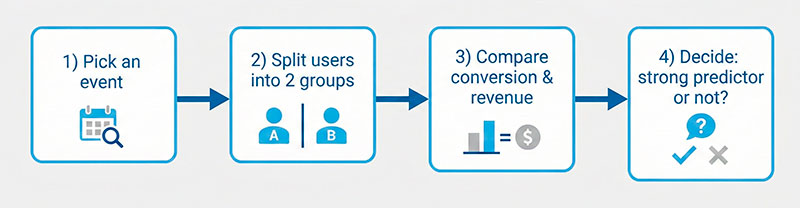
Here’s a simple process you can run monthly:
- Pick one candidate event
Choose an action you suspect is important, e.g.:- “Viewed shipping options”
- “Added to wishlist”
- “Applied coupon successfully”
- “Clicked reorder”
- Split users into two groups
For a given period (say, last 30 days):- Group A: users who triggered the event at least once
- Group B: users who were active in that period but never triggered it
- Compare a few basic metrics For each group, calculate:
- purchase conversion rateaverage revenue per user (or per session)if repeat orders matter: average number of orders per user
- Check if the difference is big and stable Example:
- Group A (used wishlist): conversion rate around 8%, revenue per user about $40
- Group B (no wishlist): conversion rate around 2%, revenue per user about $12
Repeat for a handful of events and you’ll quickly build a map:
- These 3–5 events are strong signals of intent.
- These 2–3 events are major friction points.
- These 2–3 events are powerful loyalty indicators.
That map is your shopping list for product and marketing improvements.
Turning Event Insights into Real Revenue Improvements
Events by themselves don’t move your KPIs. What you do with them does.
Here are three concrete ways to turn insights into money:
1. Boost the high-value intent events
When you know which actions are tightly linked to purchases, make them easier and more attractive:
- If wishlist usage is a strong signal:
- Put “Add to wishlist” in more prominent spots.
- Remind users about saved items in email and on-site.
- If viewing shipping is a good sign:
- Show shipping info earlier on product pages.
- Avoid hiding it behind multiple clicks.
- If starting checkout is the big “yes” moment:
- Reduce the number of steps between product and checkout.
- Make the main checkout button visually clear.
2. Fix the worst friction first
Your friction events form a bug list prioritized by revenue risk:
- Many payment errors?
- Improve error copy.
- Add alternative payment methods.
- Check how well everything works on mobile.
- Lots of invalid coupon attempts?
- Clean up old promo codes.
- Clarify which items and carts qualify.
- Avoid showing empty coupon fields if users rarely have codes.
- Strong drop-off after seeing shipping?
- Experiment with clearer free-shipping thresholds.
- Offer slower but cheaper options.
- Explain how shipping is calculated.
3. Use loyalty events for retention and upsell
Loyalty events show you who is worth extra care:
- Review writers can be thanked with small perks and early access.
- Reorder users can get quick paths to their usual products.
- Back-in-stock subscribers should be first in line when items return.
Guides on LTV, retention, and segmentation will make much more sense once you have these loyalty signals in your data.
Common Event Tracking Mistakes in E-commerce (and How to Avoid Them)
Most teams start in a similar place. Here are common pitfalls and simple fixes.
- Tracking “everything” with no clear goal
- Problem: dozens or hundreds of event names, no one remembers why they exist.
- Fix: start from a few core business questions and design events to answer them.
- Inconsistent naming
- Problem:
AddToCarton one page,add_to_basketon another,cart_addin the app. - Fix: choose a naming convention (for example,
verb_objectin lowercase with underscores) and stick to it.
- Problem:
- Meaningless generic events
- Problem: events like
button_clickwithout context. - Fix: either encode intent in the name (
add_to_cart,checkout_continue) or add a clear property (button_role: "add_to_cart").
- Problem: events like
- No useful properties
- Problem: you track
add_to_cartbut without product ID, category, or price. - Fix: add a small set of essential properties for each key event.
- Problem: you track
- No owner, no documentation
- Problem: tracking grows randomly, breaks silently, and nobody feels responsible.
- Fix: assign a human owner and keep a living document of events and meanings.
- Blind trust in agencies or tools
- Problem: everything is outsourced; the internal team doesn’t understand the data model.
- Fix: even if partners implement tracking, make sure someone in-house reads general event tracking best practices and can sanity-check the setup.
Summary: A Small Set of Events, A Big Difference in Revenue
To recap:
- Pageviews and sessions show where people went, but not what they tried to do.
- Events let you see intent, friction, and loyalty in action.
- A small, well-chosen set of events is often more powerful than hundreds of poorly defined ones.
- Simple comparisons (users with vs without a given event) already reveal which actions predict revenue.
Use this article as your practical event tracking guide: map your key journeys, choose a compact set of important events, compare groups of users, and then change your store based on what you learn.
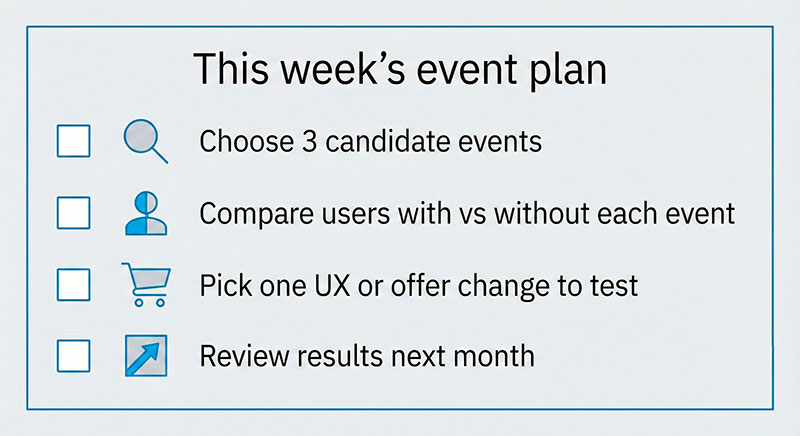
If you want a concrete starting point for this week:
- Pick three candidate events you suspect are close to money.
- Ask an analyst or developer to compare users who triggered them vs those who didn’t.
- Choose one simple UX or messaging change based on what you learn.
- Measure again next month.
You don’t need a perfect tracking plan to start making better decisions. You just need a few good events and the habit of looking at them regularly.